MAS models
Schelling’s model of segregation
What is the segregation model?
The phenomenon of segregation, in which white, black or Hispanic individuals live apart from each other in accordance with their ethnicity, and do not attempt to mingle, has become a problem for American society. Japan also has areas with high concentrations of people of Korean or Brazilian origin. The segregation model was devised for the purpose of examining the mechanism by which this phenomenon of segregation occurs. It was published in 1971 by American economist Thomas Schelling, who was awarded the Nobel Prize for economics in 2005. This is a “classic” model that can teach us some surprising things about the mechanism that might be at work behind this segregation.
Model rules
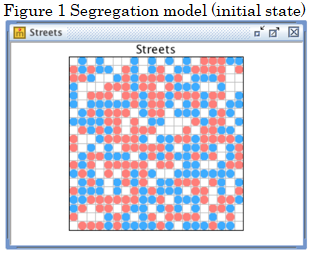
Red people and blue people live in a certain neighborhood. Initially they each live in a randomly assigned location (Figure 1). Each person knows the proportion of people of the same color (race) as themselves among the people living around them. Let us call this the “same color ratio (%).”
Everybody wants to live in proximity to a certain number of people of the same color (race). Those who are dissatisfied with the same color ratio search for an empty plot and move to it.
This criterion is called the “satisfaction level (%),” and everybody living in the neighborhood is deemed to have the same satisfaction level. For example, people with a satisfaction level of 60% who live in a location where the same color ratio for those around them is less than 60% will try to move.
When people determine where they live in accordance with these rules, what happens?
Registration with artisoc Cloud is required to run the model.
Model highlights
Formation of a neighborhood in which there is clear segregation between the places lived in by red people and those lived in by blue people (Figure 2). A satisfaction level of 60% means that half the people accept a significant proportion (40%) of those living around them having a different color. Even so, the neighborhood divides into places with red people and those with blue people.

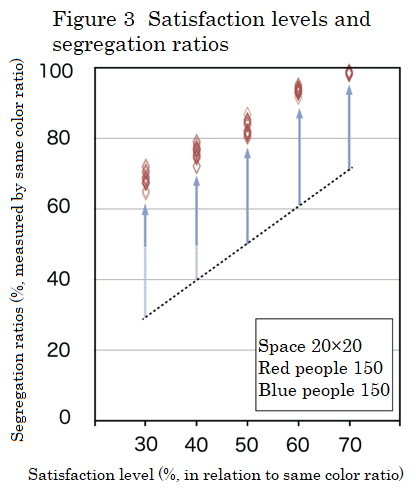
The degree of segregation among the residents of the neighborhood can be measured by taking the average same color ratio for all people (this is called the segregation ratio). It is apparent that segregation ratios are higher than satisfaction levels to a significant (in other words, unnecessary) degree (Figure 3). When people have a satisfaction level of 60%, the final segregation ratio exceeds 90%. Neighborhoods are formed in which nearly all people of the same color live together.
The behavior of this model shows that even when people do not have a particularly exclusive (racially discriminative) awareness, the phenomenon of segregated residence (segregation) still occurs for the community as a whole. Conversely, even if a neighborhood is divided, that may not mean that the residents are particularly hostile to each other. Of course, it may mean just that.
Further reading
・Gaku Doba, Jun Kobayashi, Yoshimichi Sato, Naoki Sudo, Kazuto Misumi, Ed. Tsutomu Watanabe (2004) “Understanding Society with Models: Invitation to Mathematical Sociology”, Keiso-shobo, pp. 136-139
・Thomas SCHELLING, 1971, “Dynamic Model of Segregation,” Journal of Mathematical Sociology, Vol.1, No.1, pp.143-186.
・Thomas SCHELLING, 1969, “Models of Segregation,” American Economic Review, Vol.59, No.2, pp.488-493.
[Keywords]: Segregation, racial discrimination, multi-agent simulation, model
|
Schelling’s model of segregation basic information [Model title]: Segregation model[Model designer]: Thomas Schelling [Year model announced]: 1969 [artisoc sample model creator]: Masaki Tamada, Katsuma Mitsutsuji [artisoc sample model creation date]: June 20, 2016 |