MAS models
Natural traffic congestion model
What is the natural traffic congestion occurrence model?
The natural traffic congestion model reproduces the natural traffic congestion mechanism that occurs on expressways etc. in the form of a multi-agent simulation model.
(⇒ Reference “Occurrence of natural traffic congestion”)
It defines the space as a circular test course with a radius of 37m and distributes 22 vehicle agents at equal intervals around the test course. Each vehicle agent complies with the following rules.
・Drive at a speed of 30 km/h
・If the vehicle in front gets too close, hit the brakes
・When there is enough distance to the vehicle in front, accelerate up to 30 km/h
・Impart a slight fluctuation in speed of ±0.02 km/h at each step of the simulation

Registration with artisoc Cloud is required to run the model.
Model highlights: vehicle density and traffic flow rates
Natural traffic congestion occurs more easily when vehicle densities are high and distances between vehicles are short. Using the natural traffic congestion occurrence model, we can consider the relationship between vehicle density and traffic flow rates.
We set up a point on the test course to measure the number of vehicles passing. Then we run a simulation in which we begin with 1 vehicle on the test course, and gradually increase the number of vehicles by 1 vehicle, performing 100 test drives of 10 minutes each. The results of the simulation are shown in the graph. The horizontal axis shows the number of vehicles on the test course (vehicle density), and the vertical axis shows the number of vehicles passing the measurement point every 10 minutes (traffic flow rate).
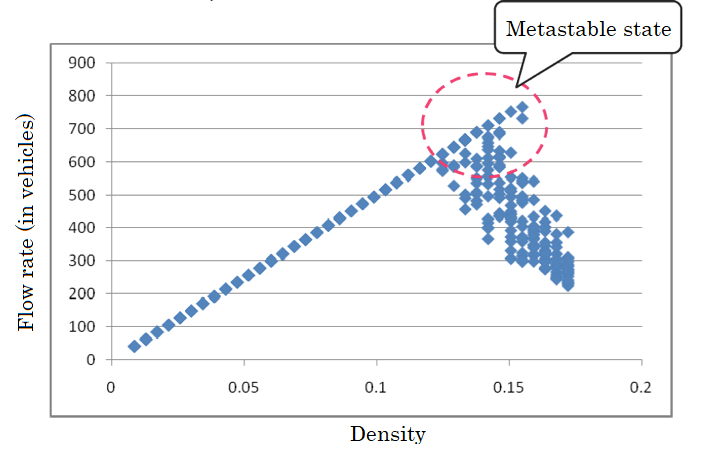
When vehicle densities are low the flow rate tends to increase monotonically in accordance with the increase in the number of vehicles, but when a certain level of density is reached, cases in which the flow rate falls dramatically begin to appear. These are the kind of cases in which congestion occurs. When vehicle densities are low, congestion does not occur, and cars flow freely, but because there are few actual vehicles, the traffic flow rate is also low. As vehicle densities rise, the number of vehicles increases and the traffic flow rate also increases. However, when congestion occurs due to the increase in vehicle density, the vehicles no longer flow smoothly and conversely the traffic flow rate declines. If the vehicle density is steadily increased, before long the vehicles can no longer move at all.
The point on which to focus is that for densities between approximately 0.12 and 0.15, states with both extremely high and low traffic flow rates occur even at the same level of density, and we find that there is considerable variation in the results. At this density, it shows that it is possible both for vehicles to flow smoothly and for congestion to occur, resulting in dramatic declines in the traffic flow rate. At this density it is possible for vehicles to flow smoothly, but this state is extremely unstable and collapses into a low flow rate immediately on the occurrence of an event such as somebody hitting the brakes. Such unstable stable states are known as “metastable states.” When natural traffic congestion occurs, it is thought that the line of vehicles on the road immediately before this occurrence must have been in a metastable state.
The ASEP model gives an extremely simple depiction of the mechanism by which such congestion occurs. For further details we recommend that you refer to publications by Professor Nishinari in the bibliography, but the use of a simple model allows us to clarify why this kind of phenomenon occurs. Vehicle movements have inertia, and when a vehicle has come to a halt it does not immediately return to its original speed. It is this that gives rise to this metastable state.
Run Natural traffic congestion model in artisoc Cloud
Metastable state
A metastable state, in which the number of vehicles has increased and vehicle densities are extremely high, but in which vehicles are flowing smoothly, is an “unstable stable state” that will, as a result of some event or other, suddenly be transformed to congestion, which is a genuinely stable state. After a long period of time has elapsed, and a variety of fluctuations have been imparted, it becomes “foam” during the transition to its genuinely stable end state.
In non-equilibrium systems, metastable states occur as a temporary stable states that emerge during a transition, caused by interactions between elements, namely the interplay between initial state and path dependence, to a genuinely stable state. In addition to vehicles just before they generate congestion, metastable states can be seen in supercooled water (if care is taken water can be cooled down to around -40°C without becoming ice, but it becomes ice if it is subject to an impact) and in glass, which is formed when silicic acid heated to high temperatures becomes a liquid, and then is cooled at relatively quickly.
As can be seen from the example of the glass, although we say “temporary” and “unstable,” this is in comparison to a genuinely stable state, and there are many metastable states that appear adequately stable to our eyes. By all means let us try to find them.
References
[1]. Katsuhiro Nishinari “Jutai Gaku”, Shinchosha, 2006
[2]. Katsuhiro Nishinari “Zukai zatsugaku: Yoku wakaru jutai gaku”, Natsumesha, 2009
[3]. JAF “Social experiment - putting congestion absorption theories into practice -”, , http://ch.jafevent.jp/detail.php?id=24,(Checked on May 20, 2016)
|
Natural traffic congestion occurrence model basic information [Model title]: Natural traffic congestion occurrence model[Model designer]: KOZO KEIKAKU ENGINEERING Inc., Toshikatsu Mori [artisoc sample model creator]: KOZO KEIKAKU ENGINEERING Inc., Toshikatsu Mori [artisoc sample model creation date]: June 1, 2008 ASEP model basic information [Model title]:ASEP (Asymmetric Simple Exclusion Process) model[Model designer]: Frank Spitzer [Year model announced]: 1970 [artisoc sample model creator]: Katsuma Mitsutsuji [artisoc sample model creation year]: 2017 |